Diffusion Testing Data for GeoFusor & T'Fusor
There is no agreed-upon industry standard for testing diffusion. We at Auralex have prepared the following test report based on one element of common practice, the polar response.
Diffusion Testing Method:
The GeoFusor22 and T’Fusor were tested in an anechoic environment, meaning the room’s boundaries are constructed in such a way as to eliminate any substantial sound reflections and to isolate the space from external noise.
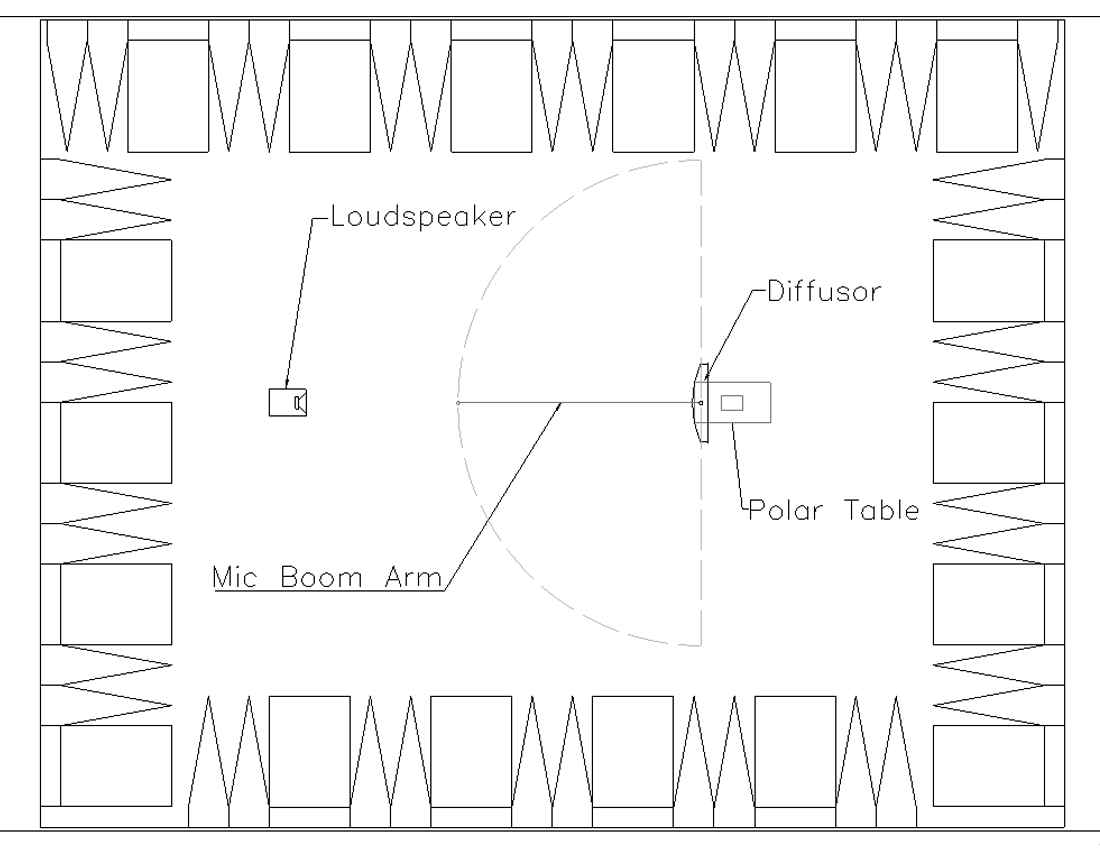
A powered loudspeaker, generating frequency sweeps, was directed toward the tested diffusor on its central axis 3 meters away. A measurement microphone was placed between the loudspeaker and the Diffusor on a boom arm connected to a polar table that moved in a consistent arc in 5° increments from -90° to +90°.
Reflected sound energy, SPL (dB), was windowed and measured at the time of flight for sound energy to travel from the loudspeaker to the diffusor, then back to the microphone after being reflected off of the diffusor. This filtered out any direct sound from the loudspeaker to the microphone.
Results and Conclusions:
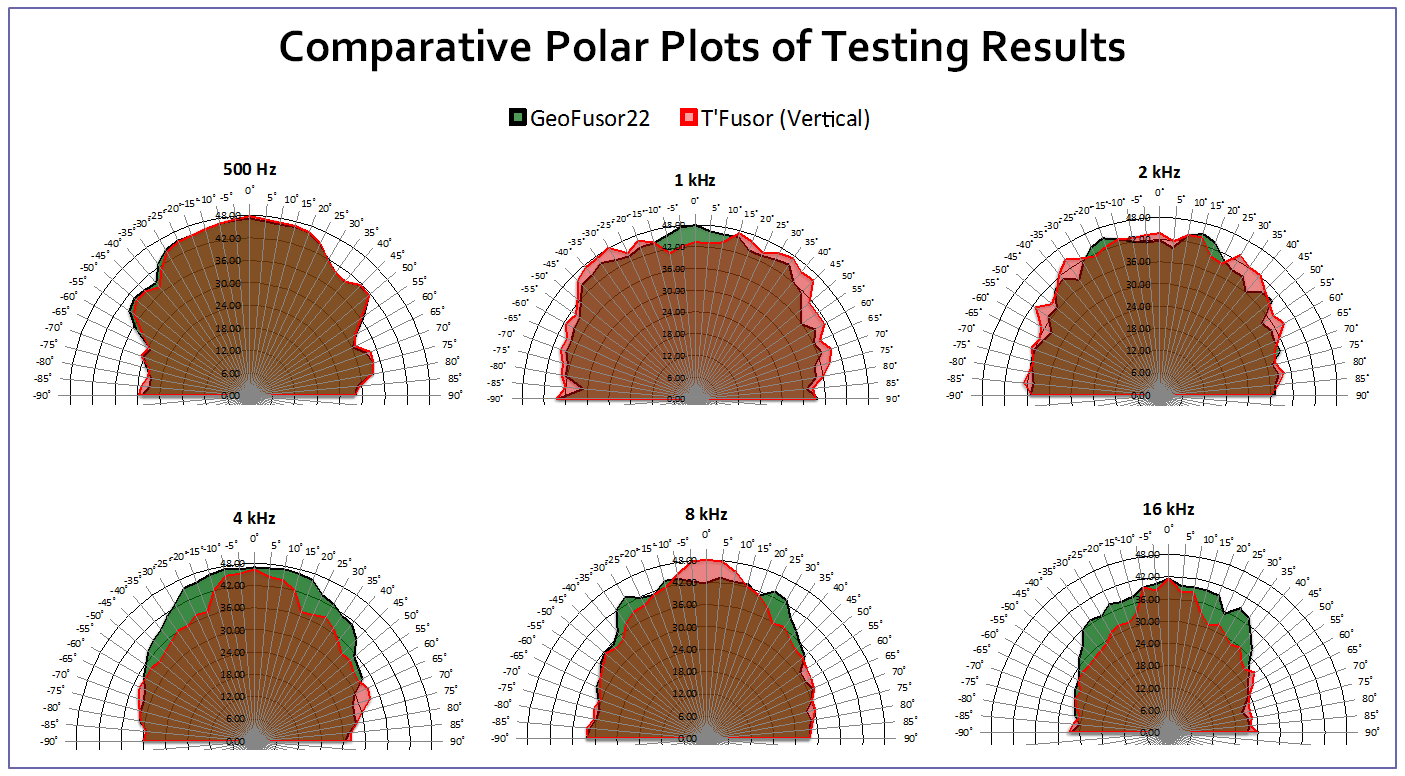
When comparing the GeoFusor to the T’Fusor, the dispersion pattern of the GeoFusor is more consistent and even over a wider frequency band than the T’Fusor (500 Hz to 16 kHz). In contrast, the T’Fusor becomes increasingly more directional with increasing frequency, directing significantly less energy off axis. This subjectively creates a brighter tonal balance in the room with noticeably different results in the perceived image and sound stage of recordings or live sessions monitored in the space.
The T’Fusor excels at livening up a space to make it sound bigger than it is and is a great choice for performance and practice rooms.
The GeoFusor imparts a more neutral spectral balance to the room while revealing a more three dimensional soundstage (width and depth). Also evident is improved separation and placement of sounds in the image of a recording from left to right and front to back.
Diffusion Testing Data:

Figure 1 (Above) is a top-view of the testing setup in the anechoic chamber, as described in "Testing Method" listed above.

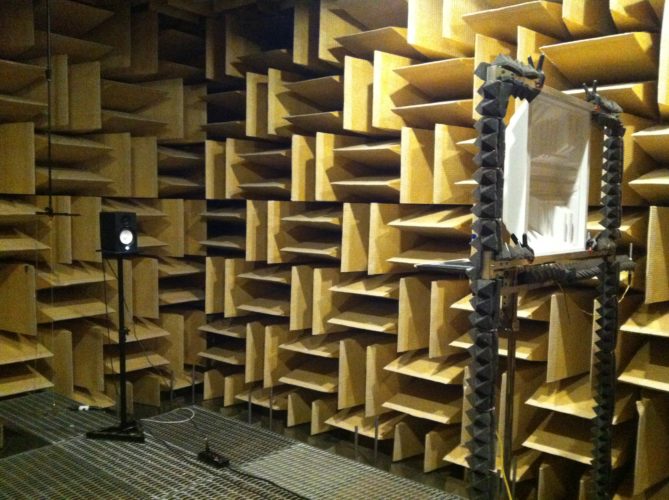
Figure 2 (Above) is a photograph taken of the testing setup, showing speaker placement and the diffusor and microphone rig.


